Here’s a talk I gave about the pros and cons of GA4, for the Wellington Content Strategy Group in late 2023. It covers my first impressions – the tool is changing all the time.
If you need help with GA4 please get in touch. At Lanalytics we offer dashboards, training, and ongoing support with GA4.
If you’re frustrated with Google Analytics 4, you’re not alone. People who used to dabble in GA can’t find the data they relied on. Those who work on content-driven sites are feeling under-served. It’s a big learning curve for all of us.
In this post I’ll share some of the big changes between Universal Analytics and GA4 when it comes to using the data to understand website performance. I’ve pulled out some useful and easy-to-use elements of the tool to get you started.
GA4 pros:
- Path Exploration to easily see user journeys through your pages.
- Smart search gives answers to your questions.
- Built-in event tracking for downloads, external link clicks, forms and video plays.
- New engagement metric.
- See the cause of spikes at a glance with graphs in standard reports.
- Report filters and Explorations provide more data freedom and flexibility.
GA4 cons:
- Different interface and fewer reports mean that data is hidden.
- Different data collection method = different metrics and volume discrepancies.
- Emphasis on marketing, conversions and purchases rather than content.
- Privacy settings = customised data collection and holes in data.
- Missing things and bugs.
GA4 pros
Path exploration report
We all need to see the user journeys through our websites, and this wasn’t done well in UA. With the GA4 Path exploration we can see journeys through our pages across multiple steps, in the form of a tree graph. It what links people are clicking on in your content.
Unlike other Explorations in GA4, this one is easy to use. Here’s a video showing you how to use the Path exploration.
The Path exploration report below shows how many people navigate from the Google Merchandise Sale page, to the Unisex pocket T Shirt product page, to the Shopping Cart. This gives us a good indication of the product’s likelihood of selling, and the navigation path taken it

Smart search
In the main GA4 search field at the top of each report you can ask targeted questions, and see data in results. For example, if I search for ‘How many users came from New Zealand last year?’, I get the volume in the results. Pretty cool, and with Google’s AI capabilities this should only improve. Maybe in the future we won’t need to use the tricksy interface at all.

Built-in event tracking
With UA you needed to manually create custom events to track crucial things like downloads, clicks on external links, and video tracking. In GA4 you can turn on enhanced event tracking with the click of a button.
We’ve found a couple of things to watch out for here – the automatic tracking doesn’t capture all the download file types, and only tracks Youtube video interactions.
You can also pull out this data into the standard reports using event/conversion filters. In the Pages and screens report below you can see click events (external ink clicks) against each page:

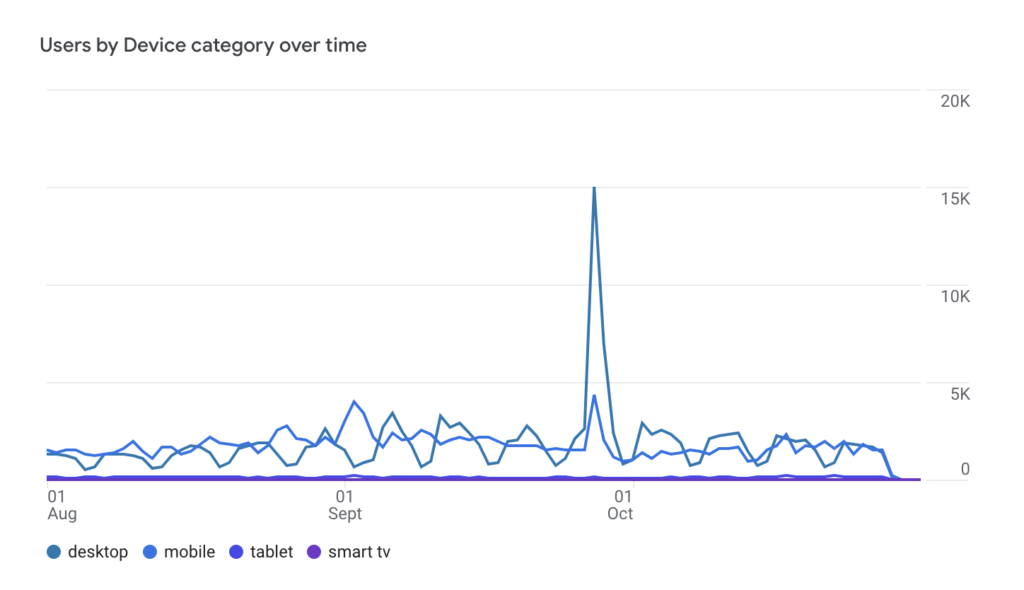
Graphs in standard reports
The standard reports contain great graphs, which show the cause of traffic spikes (page, traffic source, country, device etc.). For example in the graph below, you can see that desktop traffic contributed more than mobile for the traffic spike on September the 25th, which was Google’s 25th Birthday.
Engagement metric
In UA it was hard to see whether users were engaged, except by looking at bounce rate (single page visits).
In GA4 there is no bounce rate metric in the standard reports, instead there’s the Engagement metric. This captures the number of sessions that lasted longer than 10 seconds, or had a conversion event, or had 2 or more screen or page views. It’s a much better engagement measure.
In the demo account you can see ‘Engaged sessions’ from each of the different traffic sources. There are also Engaged sessions per user, and Engagement rate metrics.

Filters and explorations provide more data customisation
If you’re an analyst you’ll probably enjoy manipulating your data in Explorations (custom reports), and using the many filters in the standard reports to get different views on your data.
However they’re not intuitive, and you need a good knowledge of GA terminology to use them accurately. Which brings me to the cons…
GA4 cons
1. Different interface & fewer reports mean that data is hidden
You might have a lot more freedom and flexibility with your data in GA4, but you also need a lot more GA knowledge to use it effectively. UA was a rabbit warren, but I could usually find a useful report if I stumbled around for long enough.
With GA4, there are far fewer reports. We’re expected to pull the data through filters or custom reports. So you need to understand GA as a language; you need to know what metrics and dimensions are available, and use them correctly together.
2. Different data collection model = different metrics and volume discrepancies.
GA4 data is collected in a different way, so if you have regular GA reporting set up you’ll see a change in volumes. We’re seeing a 10% difference in like-for-like session volumes for some clients.
The measures (metrics) have changed – for example the old UA ‘User’ measure has been replaced with the ‘Active user’ measure in most reports, even though it stil appears as ‘User’, which only tracks engaged users.
3. Emphasis on marketing and conversions, rather than content.
GA4 is much more commerce-focussed. There’s a new section devoted to marketing, and the much-promoted predictive data is, at the moment, exclusively used for commerce data.
There’s less focus on the crucial bit between the marketing and conversions – the content. This seems like an oversight, as content is key to educate and persuade your users, and you need to know whether it’s working.
GA4 benefits large companies who have the budgets to employ people to focus on marketing and conversions. But for organisations with small digital teams it’s a blow. Many will benefit from dashboards, as explained further below. At Lanalytics, we offer customised dashboards.
4. Privacy settings = customised data collection and holes in data
The limitations imposed by privacy regulations are not a result of GA4. GA4 has been developed in large part to fill data holes left by increasingly restrictive privacy measures. But we’re feeling the effects.
Many websites are displaying cookie banners on their home page, allowing users to opt out of being tracked. This is legally enforced for sites which operate in the EU, and others are choosing to give users this autonomy.
It’s obvious that allowing users to opt out of tracking means that we are missing data, and your data can be affected in other ways. For example, for one client we saw highly inflated user volumes, and believe it’s the result returning users who choose to block cookies in some sessions but not all.
5. Missing things and bugs
This one seems trite after all the major changes we’ve covered, but the missing things are another GA4 struggle. The ones that get to me the most are:
- No regex search in standard reports.
- No property views.
- No annotations.
- No bounces, entrances and exits.
- Limited search data (inexcusable!).
- No advanced segments.
I often find bugs in GA4, and the interface keeps changing. I find this really disconcerting, and it certainly makes training interesting when new features magically appear!
Solutions
To learn GA4 you don’t need to be a data scientist or a statistician (these types often get frustrated with GA). You need to have an interest in the user experience, an analytical mindset, perseverance and lots of time!
For PMs and Managers who are wondering how to bring this skill into your team, give junior members of your team the time to learn.
If these options don’t work, dashboards are a good option. They give a clear picture of performance, and get everyone on the same page (literally) in terms of what success looks like.
In terms of tools, Looker Studio is easy to use, with clear and appealing dashboard design. You’ll need someone with a bit of expertise to set these up as it’s easy to get inaccurate data.
Also keep in mind that for any platform accessing the GA API, there’s a query limit, so you may run into data restrictions if your dashboard is really complex, or is used by many people.
At Lanaytics, we offer dashboards, GA4 training and ongoing GA4 support. Please get in touch with us if you’d like to find out more.