
If you find it tricky to get useful insights out of Google Analytics, here’s a how-to guide on my favourite technique. Advanced Segments allow you to track the people you’re interested in – those who visit certain pages, arrive by social channels, contact you or buy from you.
Different people want different things from you, and by segmenting your audience you can target each group. Don’t let the name put you off, they’re not that advanced!
What is an Advanced segment?
Advanced Segments in Google Analytics allow you to filter your website data to track groups of people who do certain things. For example you can create a segment to only show data from people who visit certain content, or those who come to your website from social media. Once you turn a segment on, it’s applied to every Google Analytics report you view until you turn it off. See the official Google guidance on Advanced Segments for more information.
To see how we used Advanced Segments for Te Papa Venues, see our post Te Papa Venues: increasing enquiries with better content.
Create an Advanced Segment
Identify the pages visited by your audience
You can track hundreds of different behaviours with Advanced Segments, but tracking the pages visited is a great place to start.
For example Te Papa offers different venues for conferences, meetings, weddings and Christmas parties. People looking for wedding venues have very different needs to those looking for conference venues.
To track our Christmas Party audience, we created an Advanced Segment to only show data from people who visit pages with ‘christmas part’ in the URL. By applying this we’re able to see how the people visiting this content interact with the whole site – which channels they arrive through, what they search for, and how many make an online enquiry.

Create an Advanced segment in Google Analytics
To create a new Advanced Segment in GA, click on the blue ring in the top left-hand corner of most GA reports:

Click on ‘New segment’:

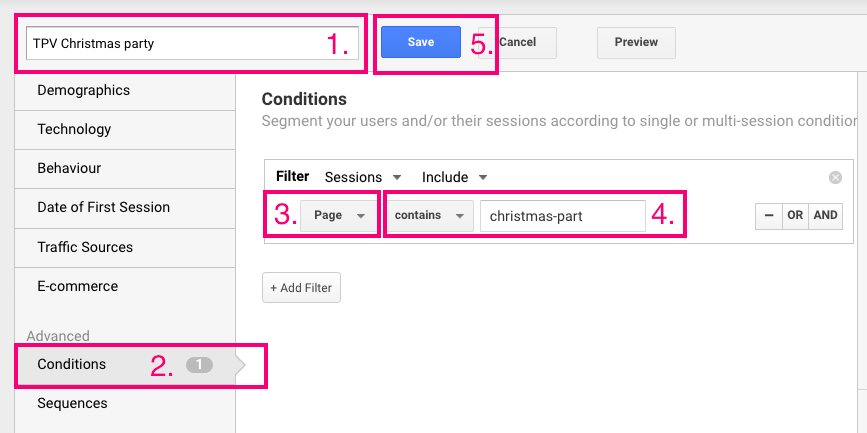
To create the segment based on page URLs:
- Enter a name for your segment.
- Click the ‘Conditions’ button in the left-hand navigation.
- Click on the dropdown and select ‘Page’.
- Enter the URL identifier.
- Save your segment and explore the different reports to find trends.
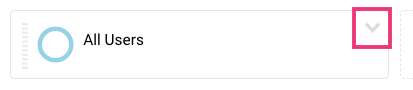
To turn the segment off, click on the downward arrow in the segment box and select ‘Remove’.
If you want help understanding your website audience, get in touch.
Audience case studies
Case study – RNZ
RNZ wanted to understand their website audience. After some in-depth analysis, we defined two main audiences. One reflects RNZ’s radio-listening audience – they are loyal, engaged, older, and return the the site regularly. The other audience was a surprise – they’re young and find news stories through social media, Google, and news aggregation services, and visit just one RNZ page before bouncing off. This ‘update me’ audience make up 70% of the audience. The findings resulted in big changes to the digital strategy including:
- Reducing home page content and upkeep.
- Holding SEO training and making technical SEO improvements which resulted in a 33% increase in Google traffic.
- Tracking audiences from different traffic sources (e.g. Facebook, Google) to understand how to promote content through these channels.
- Updating related links to encourage users to visit more RNZ pages.
See more on the RNZ case study in the post Audience data from Google Analytics.
Case study – Te Papa
The main Te Papa audience are museum visitors who look for practical information like what’s on and how to plan their visit. They make up over half the website audience.
On-site searches revealed that museum visitors wanted museum opening hours, so the team included these on every page. This resulted in an 85% drop in searches for ‘hour’. The team also ensured that the most popular exhibitions were visible high on the home page otherwise people would search for them, which is an unnecessary step in their journey.
We evolved Te Papa’s idea of their ‘museum visitor’ segment when they held a two-day Kaumatua Kapa Haka festival. This content received lots of traffic, which we assumed was from people who wanted practical information like performance times. But they were actually viewing live-streamed performance videos. Te Papa was reaching an audience beyond its physical walls, and redefined our concept of a ‘visitor’.
See more on the Te Papa case study in the Optimal Workshop blog post Understanding a museum’s digital audience.
Main image Photo by Nick Morrison on Unsplash.